


Can your class give Michael Fish a run for his money and take on the role of meteorologists?
Have you noticed how the mood of your class can change depending on the weather? Not just when children are overcome with euphoria at the promise of a snow day, or subject to cabin fever following a string of wet break times, but the subtle, everyday variations. A sunny morning can bring a smile to the face, while a hot Friday afternoon sinks everyone into a torpor. And what with the weather playing such an important role in their daily lives, children will be keen to find out more about it.
If they take interest in the weather forecast on the TV, it’s likely that pupils will want to know how it is we’re able to predict what tomorrow will bring – and why the predictions are sometimes so wide of the mark. The following project from Rising Stars’ Switched On ICT series (risingstarsuk. com/series/switched-on-ict), takes advantage of children’s curiosity about the weather. It brings together data measurement, analysis and presentation as children become weather presenters and forecasters themselves.
Data can be collected over a period of one month, but the project can easily be shortened if time is tight. There are plenty of opportunities to extend the activities as well, perhaps by linking up with another school and comparing data, or even organising a video conference with the Met Office. See how you get on.
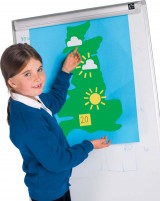 Begin with a general discussion about the weather, including the language used to describe weather. Discuss ways of describing weather with greater precision and objectivity and talk about how weather can be measured. Ask children to think of different ways to measure an aspect of the weather. Record the ideas they suggest.
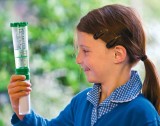
Introduce children to equipment for measuring weather and explain how to use it. This could be approached thematically, looking at temperature, pressure, rainfall, etc., or through increasing degrees of technological complexity, starting with analogue instruments, then digital and then data-logging equipment.
Extension
Setting up a joint project with a partner school elsewhere in the UK or abroad would allow comparisons between weather data to be made, as well as providing a greater sense of audience for the outcomes of the children’s analysis.
Tell children that they will be recording the weather at school for the next month. Model how to enter weather data into a spreadsheet (to make subsequent analysis easier). The use of a single, shared Google spreadsheet would allow children to see the data collected by their peers.
Working in small teams, pairs or even individually, children start taking their weather measurements, entering data into their spreadsheets. They should be encouraged to maintain their own descriptive accounts of the weather within the spreadsheet. (Change responsibilities over the course of the project so children gain experience of using a range of technologies to measure a variety of phenomena.)
Throughout the project, ask children to look through the data collected to date, highlighting any unusual data that might merit a double check.
Children could be asked to note predictions from daily weather forecasts, comparing these with observed data.
While the details of data-logging equipment will vary, it should be possible to include automatically generated data from such weather stations on a spreadsheet available to the class.
Extension
Using a digital camera to supplement the written descriptions and measured data would be useful. Some cameras or webcams can be set to extended timelapse modes, taking a photograph every hour, or every day. Edited together these make fascinating short films. Timed digital photographs would support children making connections between numeric data and observed weather.
 Combine class observations and data on to a single shared spreadsheet. Ask children to comment on any unusual data, including measurements that are unreliable or implausible, deciding as a class what to do with these results.
Introduce the children to the charting facilities available in the spreadsheet software, starting with tools to plot a time series of a single measured quantity. Allow the children to explore the formatting options available, including, perhaps, appropriate background images for their charts. Ask them to add a comment to each chart they create, explaining what it shows.
Show children other chart tools, including scatterplots, (to explore the relationship between two variables, such as average temperature and hours of sunlight, or between temperatures predicted in weather forecasts and those observed).
Extension
Children might use multiple time series to compare two or more measurements over the course of the project, or compare data during the project with historical data obtained from the Met Office.
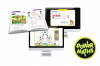
Once the children have a feel for how the data changes over time, ask them to predict the weather for the next three days, justifying their predictions on the basis of their measurements and the charts they’ve plotted. Working in teams, the children should create short presentations, in the style of a TV weather forecast, using PowerPoint or IWB software. They should describe significant aspects of the weather, including the most recent observations, and then make their predictions for the following three days, adding appropriate illustrations and explanations.
Extension
Some children might like to explore professional weather forecasting techniques; the Met Office video conference or MetLink meteorological ambassador schemes might fit in well at this point in the project.
 The children deliver their presentations to their classmates.
The children review how likely their predictions are (i.e. before the observed data isviewed). They should discuss the techniques used to make their predictions, suggesting ways in which they might have improved these.
Ask the children why they think the weather forecast for shipping is much more detailed than the weather forecast on the six o’clock news. You could play a recording to illustrate this. The children review the project, using self assessment prompts such as what was it hard (or easy) to measure? What was useful about using a spreadsheet? And what would they do differently next time? Invite them to suggest why their own, and the broadcast weather forecasts, can be wrong, and are more likely to be wrong when further in advance.
Extension
The weather forecast presentations could be filmed, and perhaps uploaded to the school website or learning platform. Videoing the weather forecasts makes it easier to compare children’s predictions with the observed weather. The activities here are taken from the We are Meteorologists project featured in the Y4 Switched On ICT resource from Rising Stars risingstars-uk.com). The complete unit also includes assessment guidance, advice on lesson preparation, curriculum links and suggestions for supporting resources.
In this project, children will record a range of weather data over an extended period of time. It involves comparing information from several sources and analysing the data using spreadsheet software. Children will also make and test predictions for the weather and then write and deliver a presentation in the style of a TV weather broadcast. By the end of this unit, children will have achieved the following learning objectives:
• To understand different measurement techniques for weather, both analogue and digital
• To use computer-based data logging to automate the recording of some weather data
• To use spreadsheets to create charts
• To analyse data
• To explore inconsistencies in data and make predictions
• To practice using presentation software and, optionally, video
Marc Bowen, deputy head at colerne primary school, gives his verdict on switched on ICT from rising stars…
If you have ever faced a topic web, willing purposeful ICT links or units of work to appear from a muddle of spreadsheets, roamers and desktop publishers then Rising Stars’ Switched on ICT is here to help. Organised by year group, across the primary phase, it provides the busy teacher with a highly structured but also highly adaptable planning, teaching and learning resource.
Each year group matched pack offers a comprehensive teacher’s book, high quality pupil task cards and a CD-ROM of associated resources. Within the teacher’s book you will find detailed planning covering a year’s worth of ICT content, which has been broken down into clearly explained and brilliantly resourced units of work. The choice of activities within each unit not only meets the requirements of the National Curriculum but has also been tailored to appeal to the interests of our increasingly tech-savvy children, without alienating the teacher. Units such as ‘Producing a Wiki’ or ‘Fusing geometry with art’ will provide the creative spark for the children, whilst also ensuring the teacher is able to utilise current and engaging technologies in a meaningful way. There is also excellent guidance on assessing progress, which has been cross-referenced with APP.
The versatility of the resource is also reflected in the content of the CD-ROM. Not only are you able to access PDF versions of the plans within the teacher’s book, there are also editable resources to use with the children. In addition, the CD-ROM holds an Excel based assessment tool which allows the user to easily track the progress of each child and the curriculum coverage of the class overall.
Another benefit for busy teachers is a comprehensive and high quality library of images and sounds, catalogued on the CDROM. Each of these resources has been closely matched to the units of work. This saves a lot of time, which might otherwise be spent trawling the internet for additional resources and will really help bring the children’s work to life. Visit risingstars-uk.com or call 0800 091 1602 for more information.
The Met Office is happy to offer schools video conferences with its staff. See http://www.metoffice.gov.uk


Power Maths – A Child-Centred, ‘Can-Do’ Mastery Teaching Programme for KS1 and KS2
Category: Maths

Fit To Dance Schools From Disney On Ice
Category: Other

‘S!ng Sensational’ And ‘A King Is Born’ – Two Fun New Musical Masterpieces That Children Will Love
Category: Music
Product review: Schofield & Sims Fractions, Decimals & Percentages
Category: Maths

Supporting parents with maths
Ace-Maths

How To Use Books To Help Children Cope With Life
Ace-English

Becoming a teaching school
Ace-Heads


